Killer Charts
Subscribe and support Underthrow.org--
Something strange has happened to the American economy. Ask people whether life has become less affordable, and you’ll probably hear the same story.
The middle class is disappearing. Wages can’t keep up. Our parents had it better. Everything costs too much.
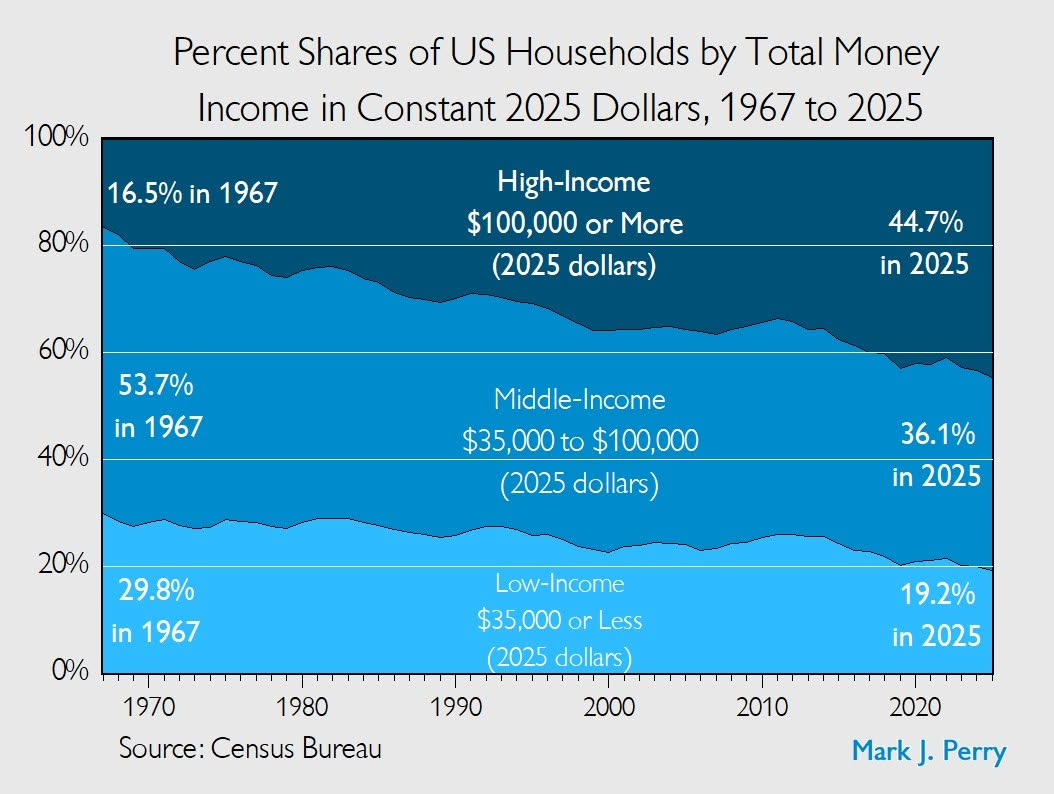
Slivers of that story are true. But then you encounter a chart like this one from the Master of Killer Charts, Mark Perry.
In 1967, adjusted for inflation, about 30 percent of American households earned less than $35,000. Today it’s about 19 percent.
Okay. So where did everybody go?
They got richer…
The skinny
The skinny isn't ready yet — notes appear once the transcript is processed.